W3cubDocs
/Matplotlibmpl_toolkits.mplot3d.axes3d.Axes3D.plot_trisurf
- Axes3D.plot_trisurf(*args, color=None, norm=None, vmin=None, vmax=None, lightsource=None, **kwargs)[source]
-
Plot a triangulated surface.
The (optional) triangulation can be specified in one of two ways; either:
plot_trisurf(triangulation, ...)
where triangulation is a
Triangulationobject, or:plot_trisurf(X, Y, ...) plot_trisurf(X, Y, triangles, ...) plot_trisurf(X, Y, triangles=triangles, ...)
in which case a Triangulation object will be created. See
Triangulationfor an explanation of these possibilities.The remaining arguments are:
plot_trisurf(..., Z)
where Z is the array of values to contour, one per point in the triangulation.
- Parameters:
-
- X, Y, Zarray-like
-
Data values as 1D arrays.
- color
-
Color of the surface patches.
- cmap
-
A colormap for the surface patches.
-
norm
Normalize, optional -
An instance of Normalize to map values to colors.
- vmin, vmaxfloat, optional
-
Minimum and maximum value to map.
- shadebool, default: True
-
Whether to shade the facecolors. Shading is always disabled when cmap is specified.
-
lightsource
LightSource, optional -
The lightsource to use when shade is True.
- **kwargs
-
All other keyword arguments are passed on to
Poly3DCollection
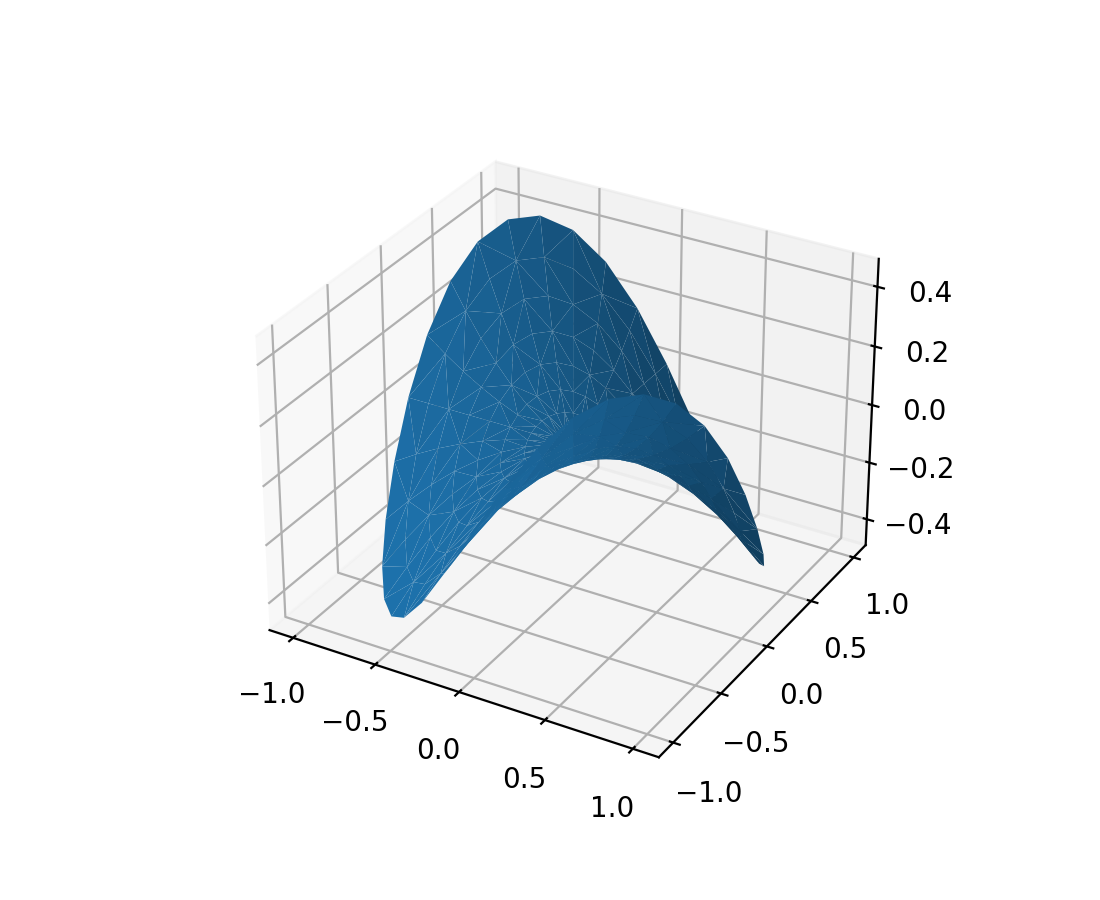
Examples
(
Source code,2x.png,png)
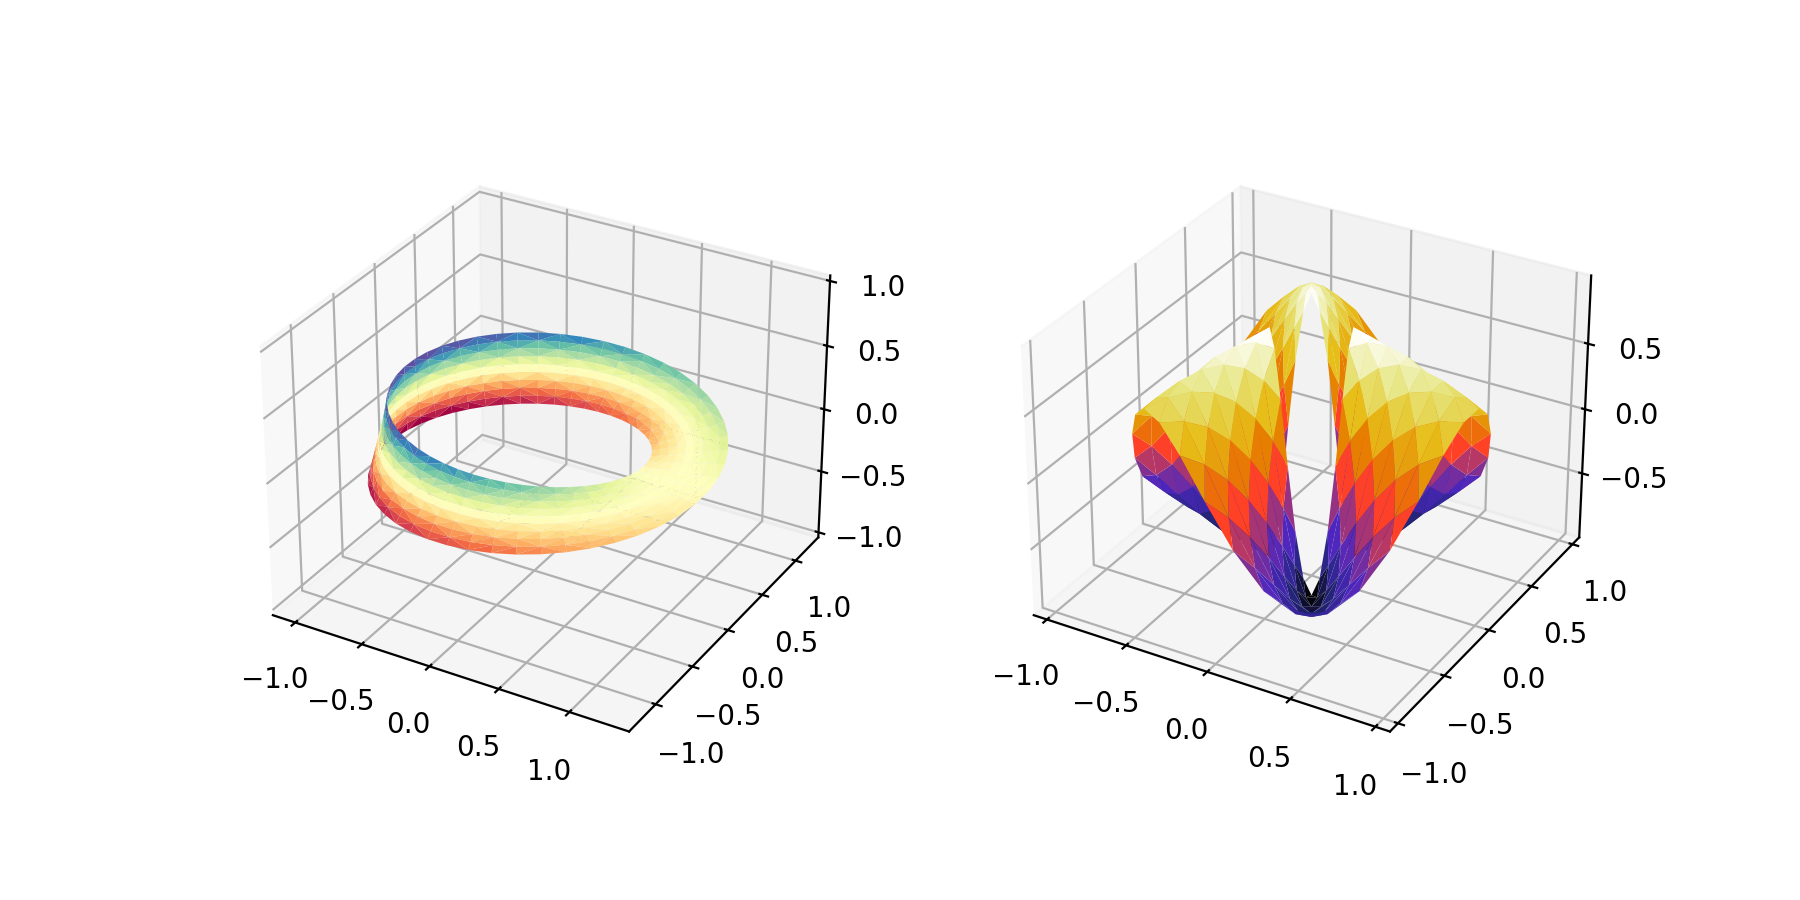
(
Source code,2x.png,png)
Examples using mpl_toolkits.mplot3d.axes3d.Axes3D.plot_trisurf


© 2012–2023 Matplotlib Development Team. All rights reserved.
Licensed under the Matplotlib License Agreement.
https://matplotlib.org/stable/api/_as_gen/mpl_toolkits.mplot3d.axes3d.Axes3D.plot_trisurf.html