W3cubDocs
/Matplotlibmpl_toolkits.mplot3d.axes3d.Axes3D.voxels
- Axes3D.voxels([x, y, z, ]/, filled, facecolors=None, edgecolors=None, **kwargs)[source]
-
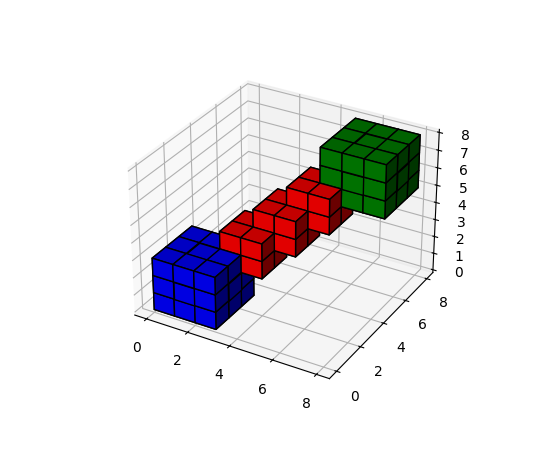
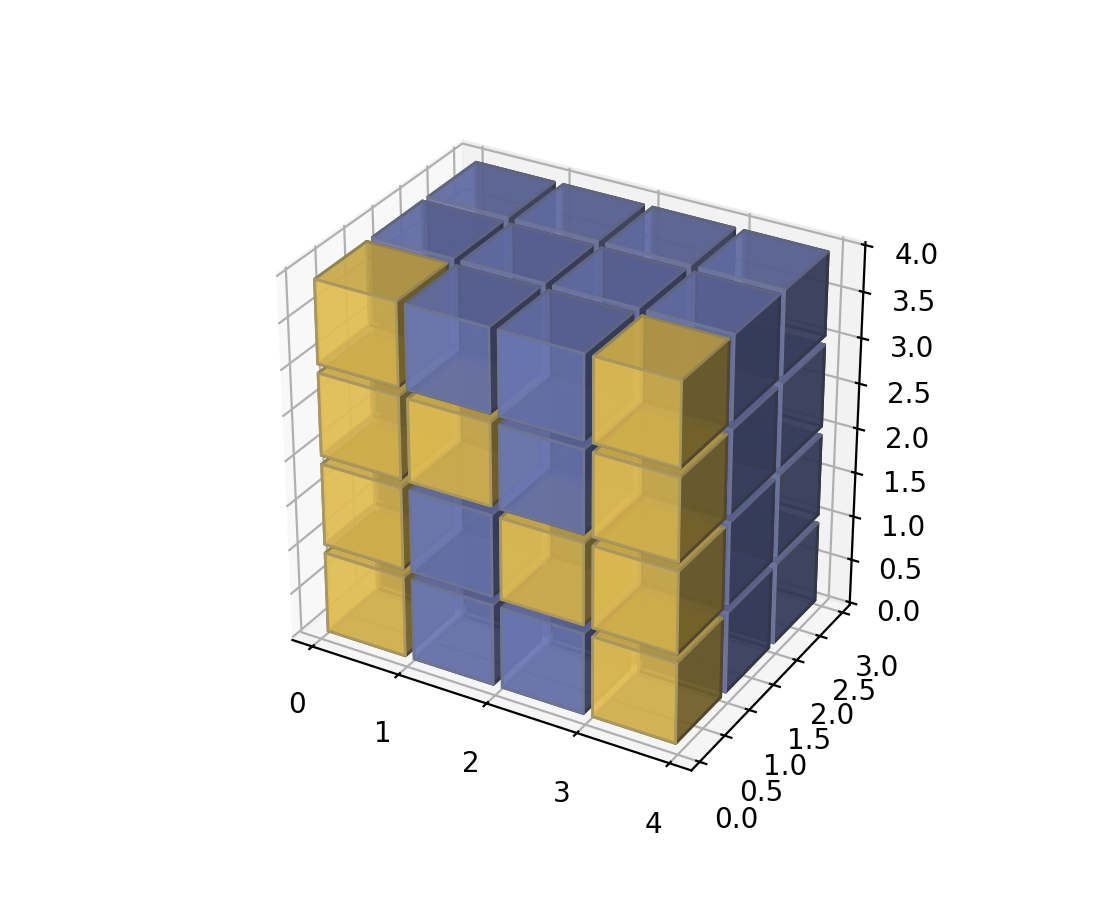
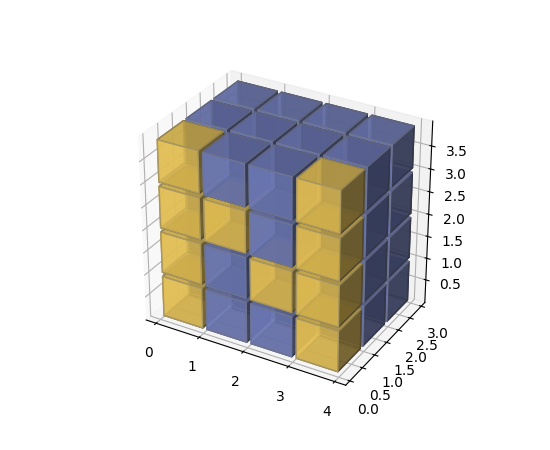
Plot a set of filled voxels
All voxels are plotted as 1x1x1 cubes on the axis, with
filled[0, 0, 0]placed with its lower corner at the origin. Occluded faces are not plotted.- Parameters:
-
- filled3D np.array of bool
-
A 3D array of values, with truthy values indicating which voxels to fill
- x, y, z3D np.array, optional
-
The coordinates of the corners of the voxels. This should broadcast to a shape one larger in every dimension than the shape of filled. These can be used to plot non-cubic voxels.
If not specified, defaults to increasing integers along each axis, like those returned by
indices(). As indicated by the/in the function signature, these arguments can only be passed positionally. - facecolors, edgecolorsarray-like, optional
-
The color to draw the faces and edges of the voxels. Can only be passed as keyword arguments. These parameters can be:
- A single color value, to color all voxels the same color. This can be either a string, or a 1D RGB/RGBA array
-
None, the default, to use a single color for the faces, and the style default for the edges. - A 3D
ndarrayof color names, with each item the color for the corresponding voxel. The size must match the voxels. - A 4D
ndarrayof RGB/RGBA data, with the components along the last axis.
- shadebool, default: True
-
Whether to shade the facecolors.
-
lightsource
LightSource, optional -
The lightsource to use when shade is True.
- **kwargs
-
Additional keyword arguments to pass onto
Poly3DCollection.
- Returns:
-
- facesdict
-
A dictionary indexed by coordinate, where
faces[i, j, k]is aPoly3DCollectionof the faces drawn for the voxelfilled[i, j, k]. If no faces were drawn for a given voxel, either because it was not asked to be drawn, or it is fully occluded, then(i, j, k) not in faces.
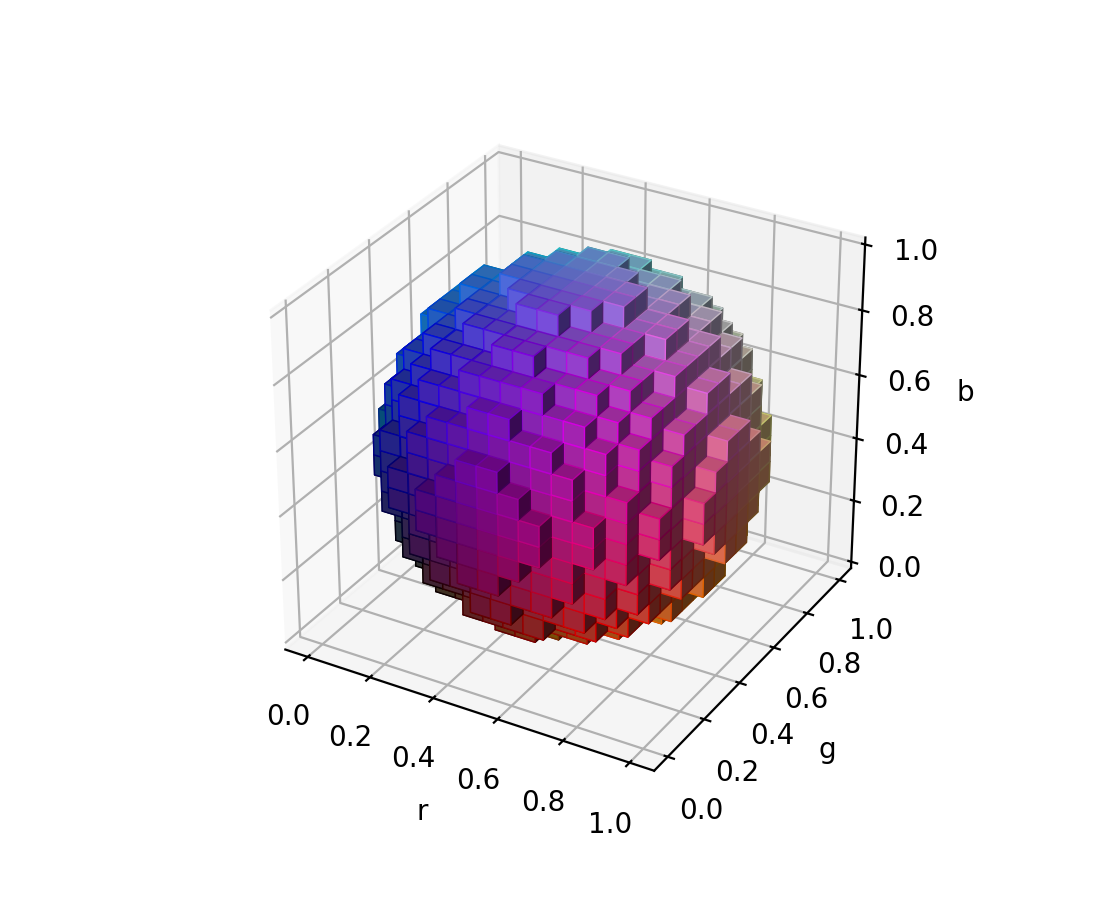
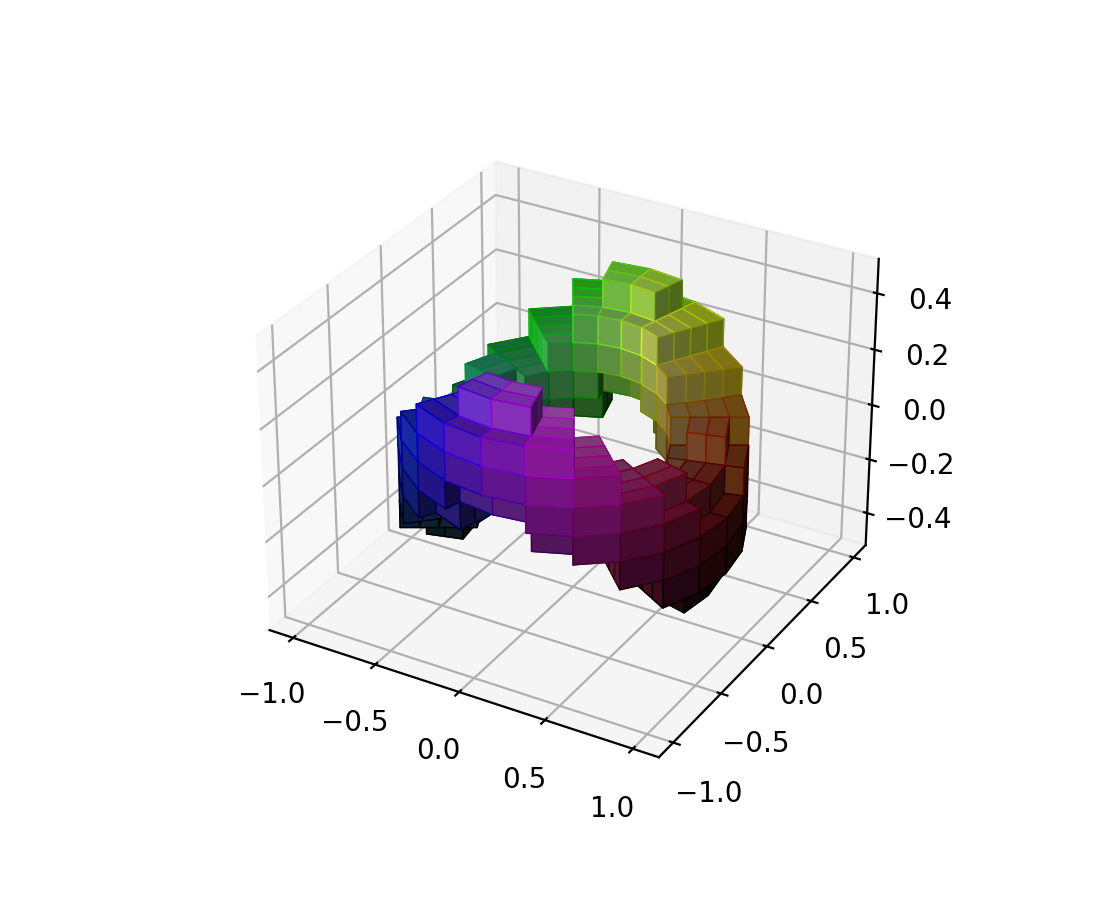
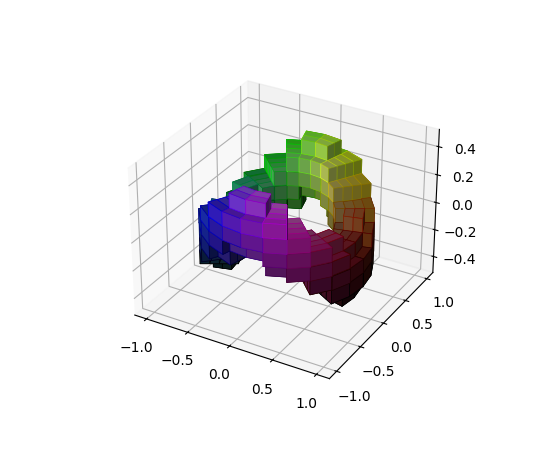
Examples
(
Source code,2x.png,png)
(
Source code,2x.png,png)
(
Source code,2x.png,png)
(
Source code,2x.png,png)


Examples using mpl_toolkits.mplot3d.axes3d.Axes3D.voxels


3D voxel / volumetric plot with cylindrical coordinates

© 2012–2023 Matplotlib Development Team. All rights reserved.
Licensed under the Matplotlib License Agreement.
https://matplotlib.org/stable/api/_as_gen/mpl_toolkits.mplot3d.axes3d.Axes3D.voxels.html