W3cubDocs
/Matplotlib 3.5mpl_toolkits.mplot3d.axes3d.Axes3D
- classmpl_toolkits.mplot3d.axes3d.Axes3D(fig, rect=None, *args, azim=- 60, elev=30, sharez=None, proj_type='persp', box_aspect=None, computed_zorder=True, **kwargs)[source]
-
Bases:
matplotlib.axes._axes.Axes3D axes object.
- Parameters
-
- figFigure
-
The parent figure.
- rect(float, float, float, float)
-
The
(left, bottom, width, height)axes position. - azimfloat, default: -60
-
Azimuthal viewing angle.
- elevfloat, default: 30
-
Elevation viewing angle.
- sharezAxes3D, optional
-
Other axes to share z-limits with.
- proj_type{'persp', 'ortho'}
-
The projection type, default 'persp'.
- computed_zorderbool, default: True
-
If True, the draw order is computed based on the average position of the
Artists along the view direction. Set to False if you want to manually control the order in which Artists are drawn on top of each other using their zorder attribute. This can be used for fine-tuning if the automatic order does not produce the desired result. Note however, that a manual zorder will only be correct for a limited view angle. If the figure is rotated by the user, it will look wrong from certain angles. - auto_add_to_figurebool, default: True
-
Prior to Matplotlib 3.4 Axes3D would add themselves to their host Figure on init. Other Axes class do not do this.
This behavior is deprecated in 3.4, the default will change to False in 3.5. The keyword will be undocumented and a non-False value will be an error in 3.6.
- **kwargs
-
Other optional keyword arguments:
Property
Description
{'box', 'datalim'}
a filter function, which takes a (m, n, 3) float array and a dpi value, and returns a (m, n, 3) array
scalar or None
(float, float) or {'C', 'SW', 'S', 'SE', 'E', 'NE', ...}
bool
{'auto'}
unknown
bool
bool
bool
Callable[[Axes, Renderer], Bbox]
bool or 'line'
3-tuple of floats or None
bool
Patch or (Path, Transform) or None
facecoloror fccolor
bool
str
bool
object
bool
unknown
None or bool or float or callable
[left, bottom, width, height] or
Bbox{'persp', 'ortho'}
unknown
float or None
bool
(scale: float, length: float, randomness: float)
bool or None
unknown
str
bool
unknown
str
xlim3dor xlimunknown
unknown
{"linear"}
unknown
unknown
unknown
str
ylim3dor ylimunknown
unknown
{"linear"}
unknown
unknown
unknown
unknown
zlim3dor zlimunknown
unknown
float
{"linear"}
unknown
unknown
- add_collection3d(col, zs=0, zdir='z')[source]
-
Add a 3D collection object to the plot.
2D collection types are converted to a 3D version by modifying the object and adding z coordinate information.
Supported are:
- PolyCollection
- LineCollection
- PatchCollection
- add_contour_set(cset, extend3d=False, stride=5, zdir='z', offset=None)[source]
- add_contourf_set(cset, zdir='z', offset=None)[source]
- apply_aspect(position=None)[source]
-
Adjust the Axes for a specified data aspect ratio.
Depending on
get_adjustablethis will modify either the Axes box (position) or the view limits. In the former case,get_anchorwill affect the position.See also
matplotlib.axes.Axes.set_aspect-
For a description of aspect ratio handling.
matplotlib.axes.Axes.set_adjustable-
Set how the Axes adjusts to achieve the required aspect ratio.
matplotlib.axes.Axes.set_anchor-
Set the position in case of extra space.
Notes
This is called automatically when each Axes is drawn. You may need to call it yourself if you need to update the Axes position and/or view limits before the Figure is drawn.
- auto_scale_xyz(X, Y, Z=None, had_data=None)[source]
- autoscale(enable=True, axis='both', tight=None)[source]
-
Convenience method for simple axis view autoscaling. See
matplotlib.axes.Axes.autoscale()for full explanation. Note that this function behaves the same, but for all three axes. Therefore, 'z' can be passed for axis, and 'both' applies to all three axes.
- autoscale_view(tight=None, scalex=True, scaley=True, scalez=True)[source]
-
Autoscale the view limits using the data limits. See
matplotlib.axes.Axes.autoscale_view()for documentation. Note that this function applies to the 3D axes, and as such adds the scalez to the function arguments.
- bar(left, height, zs=0, zdir='z', *args, data=None, **kwargs)[source]
-
Add 2D bar(s).
- Parameters
-
- left1D array-like
-
The x coordinates of the left sides of the bars.
- height1D array-like
-
The height of the bars.
- zsfloat or 1D array-like
-
Z coordinate of bars; if a single value is specified, it will be used for all bars.
- zdir{'x', 'y', 'z'}, default: 'z'
-
When plotting 2D data, the direction to use as z ('x', 'y' or 'z').
- dataindexable object, optional
-
If given, all parameters also accept a string
s, which is interpreted asdata[s](unless this raises an exception). - **kwargs
-
Other arguments are forwarded to
matplotlib.axes.Axes.bar.
- Returns
-
- mpl_toolkits.mplot3d.art3d.Patch3DCollection
- bar3d(x, y, z, dx, dy, dz, color=None, zsort='average', shade=True, lightsource=None, *args, data=None, **kwargs)[source]
-
Generate a 3D barplot.
This method creates three dimensional barplot where the width, depth, height, and color of the bars can all be uniquely set.
- Parameters
-
- x, y, zarray-like
-
The coordinates of the anchor point of the bars.
- dx, dy, dzfloat or array-like
-
The width, depth, and height of the bars, respectively.
- colorsequence of colors, optional
-
The color of the bars can be specified globally or individually. This parameter can be:
- A single color, to color all bars the same color.
- An array of colors of length N bars, to color each bar independently.
- An array of colors of length 6, to color the faces of the bars similarly.
- An array of colors of length 6 * N bars, to color each face independently.
When coloring the faces of the boxes specifically, this is the order of the coloring:
- -Z (bottom of box)
- +Z (top of box)
- -Y
- +Y
- -X
- +X
- zsortstr, optional
-
The z-axis sorting scheme passed onto
Poly3DCollection - shadebool, default: True
-
When true, this shades the dark sides of the bars (relative to the plot's source of light).
-
lightsource
LightSource -
The lightsource to use when shade is True.
- dataindexable object, optional
-
If given, all parameters also accept a string
s, which is interpreted asdata[s](unless this raises an exception). - **kwargs
-
Any additional keyword arguments are passed onto
Poly3DCollection.
- Returns
-
-
collection
Poly3DCollection -
A collection of three dimensional polygons representing the bars.
-
collection
- can_pan()[source]
-
Return whether this axes supports the pan/zoom button functionality.
3D axes objects do not use the pan/zoom button.
- can_zoom()[source]
-
Return whether this axes supports the zoom box button functionality.
3D axes objects do not use the zoom box button.
- cla()[source]
-
Clear the Axes.
- clabel(*args, **kwargs)[source]
-
Currently not implemented for 3D axes, and returns None.
- contour(X, Y, Z, *args, extend3d=False, stride=5, zdir='z', offset=None, data=None, **kwargs)[source]
-
Create a 3D contour plot.
- Parameters
-
- X, Y, Zarray-like,
-
Input data. See
contourfor acceptable data shapes. - extend3dbool, default: False
-
Whether to extend contour in 3D.
- strideint
-
Step size for extending contour.
- zdir{'x', 'y', 'z'}, default: 'z'
-
The direction to use.
- offsetfloat, optional
-
If specified, plot a projection of the contour lines at this position in a plane normal to zdir.
- dataindexable object, optional
-
If given, all parameters also accept a string
s, which is interpreted asdata[s](unless this raises an exception). - *args, **kwargs
-
Other arguments are forwarded to
matplotlib.axes.Axes.contour.
- Returns
-
- matplotlib.contour.QuadContourSet
- contour3D(X, Y, Z, *args, extend3d=False, stride=5, zdir='z', offset=None, data=None, **kwargs)[source]
-
Create a 3D contour plot.
- Parameters
-
- X, Y, Zarray-like,
-
Input data. See
contourfor acceptable data shapes. - extend3dbool, default: False
-
Whether to extend contour in 3D.
- strideint
-
Step size for extending contour.
- zdir{'x', 'y', 'z'}, default: 'z'
-
The direction to use.
- offsetfloat, optional
-
If specified, plot a projection of the contour lines at this position in a plane normal to zdir.
- dataindexable object, optional
-
If given, all parameters also accept a string
s, which is interpreted asdata[s](unless this raises an exception). - *args, **kwargs
-
Other arguments are forwarded to
matplotlib.axes.Axes.contour.
- Returns
-
- matplotlib.contour.QuadContourSet
- contourf(X, Y, Z, *args, zdir='z', offset=None, data=None, **kwargs)[source]
-
Create a 3D filled contour plot.
- Parameters
-
- X, Y, Zarray-like
-
Input data. See
contourffor acceptable data shapes. - zdir{'x', 'y', 'z'}, default: 'z'
-
The direction to use.
- offsetfloat, optional
-
If specified, plot a projection of the contour lines at this position in a plane normal to zdir.
- dataindexable object, optional
-
If given, all parameters also accept a string
s, which is interpreted asdata[s](unless this raises an exception). - *args, **kwargs
-
Other arguments are forwarded to
matplotlib.axes.Axes.contourf.
- Returns
-
- matplotlib.contour.QuadContourSet
- contourf3D(X, Y, Z, *args, zdir='z', offset=None, data=None, **kwargs)[source]
-
Create a 3D filled contour plot.
- Parameters
-
- X, Y, Zarray-like
-
Input data. See
contourffor acceptable data shapes. - zdir{'x', 'y', 'z'}, default: 'z'
-
The direction to use.
- offsetfloat, optional
-
If specified, plot a projection of the contour lines at this position in a plane normal to zdir.
- dataindexable object, optional
-
If given, all parameters also accept a string
s, which is interpreted asdata[s](unless this raises an exception). - *args, **kwargs
-
Other arguments are forwarded to
matplotlib.axes.Axes.contourf.
- Returns
-
- matplotlib.contour.QuadContourSet
- convert_zunits(z)[source]
-
For artists in an axes, if the zaxis has units support, convert z using zaxis unit type
- disable_mouse_rotation()[source]
-
Disable mouse buttons for 3D rotation and zooming.
- draw(renderer)[source]
-
Draw the Artist (and its children) using the given renderer.
This has no effect if the artist is not visible (
Artist.get_visiblereturns False).- Parameters
-
-
renderer
RendererBasesubclass.
-
renderer
Notes
This method is overridden in the Artist subclasses.
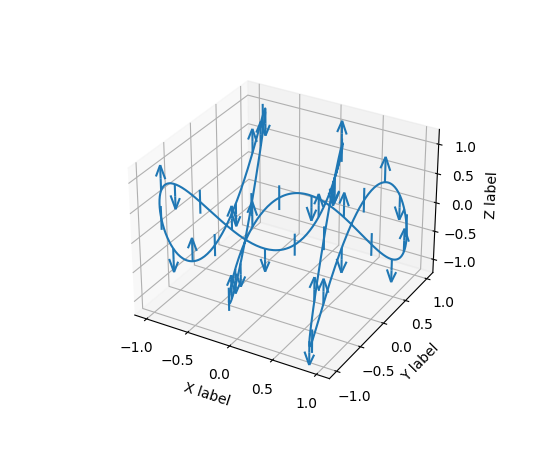
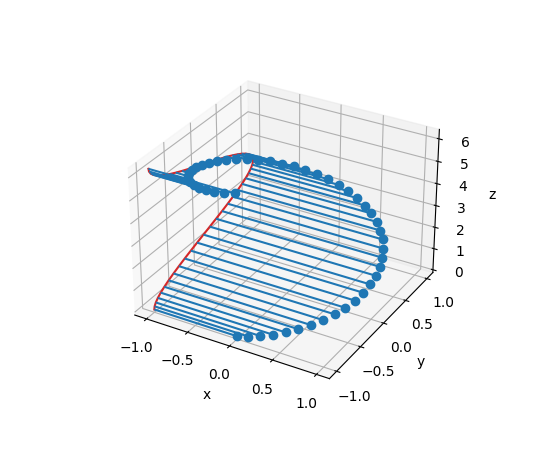
- errorbar(x, y, z, zerr=None, yerr=None, xerr=None, fmt='', barsabove=False, errorevery=1, ecolor=None, elinewidth=None, capsize=None, capthick=None, xlolims=False, xuplims=False, ylolims=False, yuplims=False, zlolims=False, zuplims=False, *, data=None, **kwargs)[source]
-
Plot lines and/or markers with errorbars around them.
x/y/z define the data locations, and xerr/yerr/zerr define the errorbar sizes. By default, this draws the data markers/lines as well the errorbars. Use fmt='none' to draw errorbars only.
- Parameters
-
- x, y, zfloat or array-like
-
The data positions.
- xerr, yerr, zerrfloat or array-like, shape (N,) or (2, N), optional
-
The errorbar sizes:
- scalar: Symmetric +/- values for all data points.
- shape(N,): Symmetric +/-values for each data point.
- shape(2, N): Separate - and + values for each bar. First row contains the lower errors, the second row contains the upper errors.
- None: No errorbar.
Note that all error arrays should have positive values.
- fmtstr, default: ''
-
The format for the data points / data lines. See
plotfor details.Use 'none' (case insensitive) to plot errorbars without any data markers.
- ecolorcolor, default: None
-
The color of the errorbar lines. If None, use the color of the line connecting the markers.
- elinewidthfloat, default: None
-
The linewidth of the errorbar lines. If None, the linewidth of the current style is used.
-
capsizefloat, default:
rcParams["errorbar.capsize"](default:0.0) -
The length of the error bar caps in points.
- capthickfloat, default: None
-
An alias to the keyword argument markeredgewidth (a.k.a. mew). This setting is a more sensible name for the property that controls the thickness of the error bar cap in points. For backwards compatibility, if mew or markeredgewidth are given, then they will over-ride capthick. This may change in future releases.
- barsabovebool, default: False
-
If True, will plot the errorbars above the plot symbols. Default is below.
- xlolims, ylolims, zlolimsbool, default: False
-
These arguments can be used to indicate that a value gives only lower limits. In that case a caret symbol is used to indicate this. lims-arguments may be scalars, or array-likes of the same length as the errors. To use limits with inverted axes,
set_xlimorset_ylimmust be called beforeerrorbar(). Note the tricky parameter names: setting e.g. ylolims to True means that the y-value is a lower limit of the True value, so, only an upward-pointing arrow will be drawn! - xuplims, yuplims, zuplimsbool, default: False
-
Same as above, but for controlling the upper limits.
- erroreveryint or (int, int), default: 1
-
draws error bars on a subset of the data. errorevery =N draws error bars on the points (x[::N], y[::N], z[::N]). errorevery =(start, N) draws error bars on the points (x[start::N], y[start::N], z[start::N]). e.g. errorevery=(6, 3) adds error bars to the data at (x[6], x[9], x[12], x[15], ...). Used to avoid overlapping error bars when two series share x-axis values.
- Returns
-
- errlineslist
-
List of
Line3DCollectioninstances each containing an errorbar line. - caplineslist
-
List of
Line3Dinstances each containing a capline object. - limmarkslist
-
List of
Line3Dinstances each containing a marker with an upper or lower limit.
- Other Parameters
-
- dataindexable object, optional
-
If given, the following parameters also accept a string
s, which is interpreted asdata[s](unless this raises an exception):x, y, z, xerr, yerr, zerr
- **kwargs
-
All other keyword arguments for styling errorbar lines are passed
Line3DCollection.
Examples
(Source code, png, pdf)

- format_coord(xd, yd)[source]
-
Given the 2D view coordinates attempt to guess a 3D coordinate. Looks for the nearest edge to the point and then assumes that the point is at the same z location as the nearest point on the edge.
- format_zdata(z)[source]
-
Return z string formatted. This function will use the
fmt_zdataattribute if it is callable, else will fall back on the zaxis major formatter
- get_autoscale_on()[source]
-
Return True if each axis is autoscaled, False otherwise.
- get_autoscalez_on()[source]
-
Return whether the z-axis is autoscaled.
- get_axis_position()[source]
- get_frame_on()[source]
-
Get whether the 3D axes panels are drawn.
- get_proj()[source]
-
Create the projection matrix from the current viewing position.
- get_tightbbox(renderer, call_axes_locator=True, bbox_extra_artists=None, *, for_layout_only=False)[source]
-
Return the tight bounding box of the axes, including axis and their decorators (xlabel, title, etc).
Artists that have
artist.set_in_layout(False)are not included in the bbox.- Parameters
-
-
renderer
RendererBasesubclass -
renderer that will be used to draw the figures (i.e.
fig.canvas.get_renderer()) -
bbox_extra_artistslist of
ArtistorNone -
List of artists to include in the tight bounding box. If
None(default), then all artist children of the Axes are included in the tight bounding box. - call_axes_locatorbool, default: True
-
If call_axes_locator is
False, it does not call the_axes_locatorattribute, which is necessary to get the correct bounding box.call_axes_locator=Falsecan be used if the caller is only interested in the relative size of the tightbbox compared to the Axes bbox. - for_layout_onlydefault: False
-
The bounding box will not include the x-extent of the title and the xlabel, or the y-extent of the ylabel.
-
renderer
- Returns
-
BboxBase-
Bounding box in figure pixel coordinates.
- get_w_lims()[source]
-
Get 3D world limits.
- get_xlim()[source]
-
Alias for
get_xlim3d.
- get_xlim3d()[source]
-
Return the x-axis view limits.
- Returns
-
- left, right(float, float)
-
The current x-axis limits in data coordinates.
See also
set_xlim-
set_xbound,get_xbound -
invert_xaxis,xaxis_inverted
Notes
The x-axis may be inverted, in which case the left value will be greater than the right value.
- get_ylim()[source]
-
Alias for
get_ylim3d.
- get_ylim3d()[source]
-
Return the y-axis view limits.
- Returns
-
- bottom, top(float, float)
-
The current y-axis limits in data coordinates.
See also
set_ylim-
set_ybound,get_ybound -
invert_yaxis,yaxis_inverted
Notes
The y-axis may be inverted, in which case the bottom value will be greater than the top value.
- get_zbound()[source]
-
Return the lower and upper z-axis bounds, in increasing order.
- get_zlabel()[source]
-
Get the z-label text string.
- get_zlim()[source]
-
Alias for
get_zlim3d.
- get_zlim3d()[source]
-
Get 3D z limits.
- get_zscale()[source]
- get_zticklabels(minor=False, which=None)[source]
-
Get the zaxis' tick labels.
- Parameters
-
- minorbool
-
Whether to return the minor or the major ticklabels.
- whichNone, ('minor', 'major', 'both')
-
Overrides minor.
Selects which ticklabels to return
- Returns
-
- list of
Text
- list of
Notes
The tick label strings are not populated until a
drawmethod has been called.
- get_zticks(*, minor=False)[source]
-
Return the zaxis' tick locations in data coordinates.
- grid(visible=True, **kwargs)[source]
-
Set / unset 3D grid.
Note
Currently, this function does not behave the same as
matplotlib.axes.Axes.grid(), but it is intended to eventually support that behavior.
- invert_zaxis()[source]
-
Invert the z-axis.
- locator_params(axis='both', tight=None, **kwargs)[source]
-
Convenience method for controlling tick locators.
See
matplotlib.axes.Axes.locator_params()for full documentation. Note that this is for Axes3D objects, therefore, setting axis to 'both' will result in the parameters being set for all three axes. Also, axis can also take a value of 'z' to apply parameters to the z axis.
- margins(*margins, x=None, y=None, z=None, tight=True)[source]
-
Convenience method to set or retrieve autoscaling margins.
Call signatures:
margins()
returns xmargin, ymargin, zmargin
margins(margin)

margins(xmargin, ymargin, zmargin)

margins(x=xmargin, y=ymargin, z=zmargin)

margins(..., tight=False)
All forms above set the xmargin, ymargin and zmargin parameters. All keyword parameters are optional. A single positional argument specifies xmargin, ymargin and zmargin. Passing both positional and keyword arguments for xmargin, ymargin, and/or zmargin is invalid.
The tight parameter is passed to
autoscale_view(), which is executed after a margin is changed; the default here is True, on the assumption that when margins are specified, no additional padding to match tick marks is usually desired. Setting tight to None will preserve the previous setting.Specifying any margin changes only the autoscaling; for example, if xmargin is not None, then xmargin times the X data interval will be added to each end of that interval before it is used in autoscaling.
- mouse_init(rotate_btn=1, zoom_btn=3)[source]
-
Set the mouse buttons for 3D rotation and zooming.
- Parameters
-
- rotate_btnint or list of int, default: 1
-
The mouse button or buttons to use for 3D rotation of the axes.
- zoom_btnint or list of int, default: 3
-
The mouse button or buttons to use to zoom the 3D axes.
- name='3d'
- plot(xs, ys, *args, zdir='z', **kwargs)[source]
-
Plot 2D or 3D data.
- Parameters
-
- xs1D array-like
-
x coordinates of vertices.
- ys1D array-like
-
y coordinates of vertices.
- zsfloat or 1D array-like
-
z coordinates of vertices; either one for all points or one for each point.
- zdir{'x', 'y', 'z'}, default: 'z'
-
When plotting 2D data, the direction to use as z ('x', 'y' or 'z').
- **kwargs
-
Other arguments are forwarded to
matplotlib.axes.Axes.plot.
- plot3D(xs, ys, *args, zdir='z', **kwargs)[source]
-
Plot 2D or 3D data.
- Parameters
-
- xs1D array-like
-
x coordinates of vertices.
- ys1D array-like
-
y coordinates of vertices.
- zsfloat or 1D array-like
-
z coordinates of vertices; either one for all points or one for each point.
- zdir{'x', 'y', 'z'}, default: 'z'
-
When plotting 2D data, the direction to use as z ('x', 'y' or 'z').
- **kwargs
-
Other arguments are forwarded to
matplotlib.axes.Axes.plot.
- plot_surface(X, Y, Z, *args, norm=None, vmin=None, vmax=None, lightsource=None, **kwargs)[source]
-
Create a surface plot.
By default it will be colored in shades of a solid color, but it also supports colormapping by supplying the cmap argument.
Note
The rcount and ccount kwargs, which both default to 50, determine the maximum number of samples used in each direction. If the input data is larger, it will be downsampled (by slicing) to these numbers of points.
Note
To maximize rendering speed consider setting rstride and cstride to divisors of the number of rows minus 1 and columns minus 1 respectively. For example, given 51 rows rstride can be any of the divisors of 50.
Similarly, a setting of rstride and cstride equal to 1 (or rcount and ccount equal the number of rows and columns) can use the optimized path.
- Parameters
-
- X, Y, Z2D arrays
-
Data values.
- rcount, ccountint
-
Maximum number of samples used in each direction. If the input data is larger, it will be downsampled (by slicing) to these numbers of points. Defaults to 50.
- rstride, cstrideint
-
Downsampling stride in each direction. These arguments are mutually exclusive with rcount and ccount. If only one of rstride or cstride is set, the other defaults to 10.
'classic' mode uses a default of
rstride = cstride = 10instead of the new default ofrcount = ccount = 50. - colorcolor-like
-
Color of the surface patches.
- cmapColormap
-
Colormap of the surface patches.
- facecolorsarray-like of colors.
-
Colors of each individual patch.
- normNormalize
-
Normalization for the colormap.
- vmin, vmaxfloat
-
Bounds for the normalization.
- shadebool, default: True
-
Whether to shade the facecolors. Shading is always disabled when cmap is specified.
-
lightsource
LightSource -
The lightsource to use when shade is True.
- **kwargs
-
Other arguments are forwarded to
Poly3DCollection.
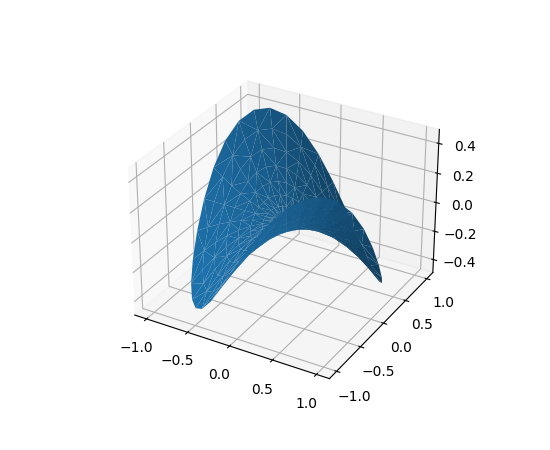
- plot_trisurf(*args, color=None, norm=None, vmin=None, vmax=None, lightsource=None, **kwargs)[source]
-
Plot a triangulated surface.
The (optional) triangulation can be specified in one of two ways; either:
plot_trisurf(triangulation, ...)
where triangulation is a
Triangulationobject, or:plot_trisurf(X, Y, ...) plot_trisurf(X, Y, triangles, ...) plot_trisurf(X, Y, triangles=triangles, ...)
in which case a Triangulation object will be created. See
Triangulationfor a explanation of these possibilities.The remaining arguments are:
plot_trisurf(..., Z)
where Z is the array of values to contour, one per point in the triangulation.
- Parameters
-
- X, Y, Zarray-like
-
Data values as 1D arrays.
- color
-
Color of the surface patches.
- cmap
-
A colormap for the surface patches.
- normNormalize
-
An instance of Normalize to map values to colors.
- vmin, vmaxfloat, default: None
-
Minimum and maximum value to map.
- shadebool, default: True
-
Whether to shade the facecolors. Shading is always disabled when cmap is specified.
-
lightsource
LightSource -
The lightsource to use when shade is True.
- **kwargs
-
All other arguments are passed on to
Poly3DCollection
Examples
(Source code, png, pdf)

(Source code, png, pdf)

- plot_wireframe(X, Y, Z, *args, **kwargs)[source]
-
Plot a 3D wireframe.
Note
The rcount and ccount kwargs, which both default to 50, determine the maximum number of samples used in each direction. If the input data is larger, it will be downsampled (by slicing) to these numbers of points.
- Parameters
-
- X, Y, Z2D arrays
-
Data values.
- rcount, ccountint
-
Maximum number of samples used in each direction. If the input data is larger, it will be downsampled (by slicing) to these numbers of points. Setting a count to zero causes the data to be not sampled in the corresponding direction, producing a 3D line plot rather than a wireframe plot. Defaults to 50.
- rstride, cstrideint
-
Downsampling stride in each direction. These arguments are mutually exclusive with rcount and ccount. If only one of rstride or cstride is set, the other defaults to 1. Setting a stride to zero causes the data to be not sampled in the corresponding direction, producing a 3D line plot rather than a wireframe plot.
'classic' mode uses a default of
rstride = cstride = 1instead of the new default ofrcount = ccount = 50. - **kwargs
-
Other arguments are forwarded to
Line3DCollection.
- quiver(X, Y, Z, U, V, W, /, length=1, arrow_length_ratio=.3, pivot='tail', normalize=False, **kwargs)[source]
-
Plot a 3D field of arrows.
The arguments could be array-like or scalars, so long as they they can be broadcast together. The arguments can also be masked arrays. If an element in any of argument is masked, then that corresponding quiver element will not be plotted.
- Parameters
-
- X, Y, Zarray-like
-
The x, y and z coordinates of the arrow locations (default is tail of arrow; see pivot kwarg).
- U, V, Warray-like
-
The x, y and z components of the arrow vectors.
- lengthfloat, default: 1
-
The length of each quiver.
- arrow_length_ratiofloat, default: 0.3
-
The ratio of the arrow head with respect to the quiver.
- pivot{'tail', 'middle', 'tip'}, default: 'tail'
-
The part of the arrow that is at the grid point; the arrow rotates about this point, hence the name pivot.
- normalizebool, default: False
-
Whether all arrows are normalized to have the same length, or keep the lengths defined by u, v, and w.
- dataindexable object, optional
-
If given, all parameters also accept a string
s, which is interpreted asdata[s](unless this raises an exception). - **kwargs
-
Any additional keyword arguments are delegated to
LineCollection
- quiver3D(X, Y, Z, U, V, W, /, length=1, arrow_length_ratio=.3, pivot='tail', normalize=False, **kwargs)[source]
-
Plot a 3D field of arrows.
The arguments could be array-like or scalars, so long as they they can be broadcast together. The arguments can also be masked arrays. If an element in any of argument is masked, then that corresponding quiver element will not be plotted.
- Parameters
-
- X, Y, Zarray-like
-
The x, y and z coordinates of the arrow locations (default is tail of arrow; see pivot kwarg).
- U, V, Warray-like
-
The x, y and z components of the arrow vectors.
- lengthfloat, default: 1
-
The length of each quiver.
- arrow_length_ratiofloat, default: 0.3
-
The ratio of the arrow head with respect to the quiver.
- pivot{'tail', 'middle', 'tip'}, default: 'tail'
-
The part of the arrow that is at the grid point; the arrow rotates about this point, hence the name pivot.
- normalizebool, default: False
-
Whether all arrows are normalized to have the same length, or keep the lengths defined by u, v, and w.
- dataindexable object, optional
-
If given, all parameters also accept a string
s, which is interpreted asdata[s](unless this raises an exception). - **kwargs
-
Any additional keyword arguments are delegated to
LineCollection
- scatter(xs, ys, zs=0, zdir='z', s=20, c=None, depthshade=True, *args, data=None, **kwargs)[source]
-
Create a scatter plot.
- Parameters
-
- xs, ysarray-like
-
The data positions.
- zsfloat or array-like, default: 0
-
The z-positions. Either an array of the same length as xs and ys or a single value to place all points in the same plane.
- zdir{'x', 'y', 'z', '-x', '-y', '-z'}, default: 'z'
-
The axis direction for the zs. This is useful when plotting 2D data on a 3D Axes. The data must be passed as xs, ys. Setting zdir to 'y' then plots the data to the x-z-plane.
See also Plot 2D data on 3D plot.
- sfloat or array-like, default: 20
-
The marker size in points**2. Either an array of the same length as xs and ys or a single value to make all markers the same size.
- ccolor, sequence, or sequence of colors, optional
-
The marker color. Possible values:
- A single color format string.
- A sequence of colors of length n.
- A sequence of n numbers to be mapped to colors using cmap and norm.
- A 2D array in which the rows are RGB or RGBA.
For more details see the c argument of
scatter. - depthshadebool, default: True
-
Whether to shade the scatter markers to give the appearance of depth. Each call to
scatter()will perform its depthshading independently. - dataindexable object, optional
-
If given, the following parameters also accept a string
s, which is interpreted asdata[s](unless this raises an exception):xs, ys, zs, s, edgecolors, c, facecolor, facecolors, color
- **kwargs
-
All other arguments are passed on to
scatter.
- Returns
-
-
paths
PathCollection
-
paths
- scatter3D(xs, ys, zs=0, zdir='z', s=20, c=None, depthshade=True, *args, data=None, **kwargs)[source]
-
Create a scatter plot.
- Parameters
-
- xs, ysarray-like
-
The data positions.
- zsfloat or array-like, default: 0
-
The z-positions. Either an array of the same length as xs and ys or a single value to place all points in the same plane.
- zdir{'x', 'y', 'z', '-x', '-y', '-z'}, default: 'z'
-
The axis direction for the zs. This is useful when plotting 2D data on a 3D Axes. The data must be passed as xs, ys. Setting zdir to 'y' then plots the data to the x-z-plane.
See also Plot 2D data on 3D plot.
- sfloat or array-like, default: 20
-
The marker size in points**2. Either an array of the same length as xs and ys or a single value to make all markers the same size.
- ccolor, sequence, or sequence of colors, optional
-
The marker color. Possible values:
- A single color format string.
- A sequence of colors of length n.
- A sequence of n numbers to be mapped to colors using cmap and norm.
- A 2D array in which the rows are RGB or RGBA.
For more details see the c argument of
scatter. - depthshadebool, default: True
-
Whether to shade the scatter markers to give the appearance of depth. Each call to
scatter()will perform its depthshading independently. - dataindexable object, optional
-
If given, the following parameters also accept a string
s, which is interpreted asdata[s](unless this raises an exception):xs, ys, zs, s, edgecolors, c, facecolor, facecolors, color
- **kwargs
-
All other arguments are passed on to
scatter.
- Returns
-
-
paths
PathCollection
-
paths
- set(*, adjustable=<UNSET>, agg_filter=<UNSET>, alpha=<UNSET>, anchor=<UNSET>, animated=<UNSET>, aspect=<UNSET>, autoscale_on=<UNSET>, autoscalex_on=<UNSET>, autoscaley_on=<UNSET>, autoscalez_on=<UNSET>, axes_locator=<UNSET>, axisbelow=<UNSET>, box_aspect=<UNSET>, clip_box=<UNSET>, clip_on=<UNSET>, clip_path=<UNSET>, facecolor=<UNSET>, frame_on=<UNSET>, gid=<UNSET>, in_layout=<UNSET>, label=<UNSET>, navigate=<UNSET>, path_effects=<UNSET>, picker=<UNSET>, position=<UNSET>, proj_type=<UNSET>, prop_cycle=<UNSET>, rasterization_zorder=<UNSET>, rasterized=<UNSET>, sketch_params=<UNSET>, snap=<UNSET>, title=<UNSET>, transform=<UNSET>, url=<UNSET>, visible=<UNSET>, xbound=<UNSET>, xlabel=<UNSET>, xlim=<UNSET>, xlim3d=<UNSET>, xmargin=<UNSET>, xscale=<UNSET>, xticklabels=<UNSET>, xticks=<UNSET>, ybound=<UNSET>, ylabel=<UNSET>, ylim=<UNSET>, ylim3d=<UNSET>, ymargin=<UNSET>, yscale=<UNSET>, yticklabels=<UNSET>, yticks=<UNSET>, zbound=<UNSET>, zlabel=<UNSET>, zlim3d=<UNSET>, zmargin=<UNSET>, zorder=<UNSET>, zscale=<UNSET>, zticklabels=<UNSET>, zticks=<UNSET>)[source]
-
Set multiple properties at once.
Supported properties are
Property
Description
{'box', 'datalim'}
a filter function, which takes a (m, n, 3) float array and a dpi value, and returns a (m, n, 3) array
scalar or None
(float, float) or {'C', 'SW', 'S', 'SE', 'E', 'NE', ...}
bool
{'auto'}
unknown
bool
bool
bool
Callable[[Axes, Renderer], Bbox]
bool or 'line'
3-tuple of floats or None
bool
Patch or (Path, Transform) or None
facecoloror fccolor
bool
str
bool
object
bool
unknown
None or bool or float or callable
[left, bottom, width, height] or
Bbox{'persp', 'ortho'}
unknown
float or None
bool
(scale: float, length: float, randomness: float)
bool or None
unknown
str
bool
unknown
str
(bottom: float, top: float)
unknown
unknown
{"linear"}
unknown
unknown
unknown
str
(bottom: float, top: float)
unknown
unknown
{"linear"}
unknown
unknown
unknown
unknown
unknown
unknown
float
{"linear"}
unknown
unknown
- set_aspect(aspect, adjustable=None, anchor=None, share=False)[source]
-
Set the aspect ratios.
Axes 3D does not current support any aspect but 'auto' which fills the axes with the data limits.
To simulate having equal aspect in data space, set the ratio of your data limits to match the value of
get_box_aspect. To control box aspect ratios useset_box_aspect.- Parameters
-
- aspect{'auto'}
-
Possible values:
value
description
'auto'
automatic; fill the position rectangle with data.
- adjustableNone
-
Currently ignored by Axes3D
If not None, this defines which parameter will be adjusted to meet the required aspect. See
set_adjustablefor further details. - anchorNone or str or 2-tuple of float, optional
-
If not None, this defines where the Axes will be drawn if there is extra space due to aspect constraints. The most common way to to specify the anchor are abbreviations of cardinal directions:
value
description
'C'
centered
'SW'
lower left corner
'S'
middle of bottom edge
'SE'
lower right corner
etc.
See
set_anchorfor further details. - sharebool, default: False
-
If
True, apply the settings to all shared Axes.
- set_autoscale_on(b)[source]
-
Set whether autoscaling is applied to each axis on the next draw or call to
Axes.autoscale_view.- Parameters
-
- bbool
- set_autoscalez_on(b)[source]
-
Set whether the z-axis is autoscaled on the next draw or call to
Axes.autoscale_view.- Parameters
-
- bbool
- set_axis_off()[source]
-
Turn the x- and y-axis off.
This affects the axis lines, ticks, ticklabels, grid and axis labels.
- set_axis_on()[source]
-
Turn the x- and y-axis on.
This affects the axis lines, ticks, ticklabels, grid and axis labels.
- set_box_aspect(aspect, *, zoom=1)[source]
-
Set the axes box aspect.
The box aspect is the ratio of height to width in display units for each face of the box when viewed perpendicular to that face. This is not to be confused with the data aspect (which for Axes3D is always 'auto'). The default ratios are 4:4:3 (x:y:z).
To simulate having equal aspect in data space, set the box aspect to match your data range in each dimension.
zoom controls the overall size of the Axes3D in the figure.
- Parameters
-
- aspect3-tuple of floats or None
-
Changes the physical dimensions of the Axes3D, such that the ratio of the axis lengths in display units is x:y:z.
If None, defaults to 4:4:3
- zoomfloat
-
Control overall size of the Axes3D in the figure.
- set_frame_on(b)[source]
-
Set whether the 3D axes panels are drawn.
- Parameters
-
- bbool
- set_proj_type(proj_type)[source]
-
Set the projection type.
- Parameters
-
- proj_type{'persp', 'ortho'}
- set_title(label, fontdict=None, loc='center', **kwargs)[source]
-
Set a title for the Axes.
Set one of the three available Axes titles. The available titles are positioned above the Axes in the center, flush with the left edge, and flush with the right edge.
- Parameters
-
- labelstr
-
Text to use for the title
- fontdictdict
-
A dictionary controlling the appearance of the title text, the default fontdict is:
{'fontsize': rcParams['axes.titlesize'], 'fontweight': rcParams['axes.titleweight'], 'color': rcParams['axes.titlecolor'], 'verticalalignment': 'baseline', 'horizontalalignment': loc} -
loc{'center', 'left', 'right'}, default:
rcParams["axes.titlelocation"](default:'center') -
Which title to set.
-
yfloat, default:
rcParams["axes.titley"](default:None) -
Vertical Axes loation for the title (1.0 is the top). If None (the default), y is determined automatically to avoid decorators on the Axes.
-
padfloat, default:
rcParams["axes.titlepad"](default:6.0) -
The offset of the title from the top of the Axes, in points.
- Returns
-
Text-
The matplotlib text instance representing the title
- Other Parameters
- set_top_view()[source]
- set_xlim(left=None, right=None, emit=True, auto=False, *, xmin=None, xmax=None)[source]
-
Alias for
set_xlim3d.
- set_xlim3d(left=None, right=None, emit=True, auto=False, *, xmin=None, xmax=None)[source]
-
Set 3D x limits.
See
matplotlib.axes.Axes.set_xlim()for full documentation.
- set_xmargin(m)[source]
-
Set padding of X data limits prior to autoscaling.
m times the data interval will be added to each end of that interval before it is used in autoscaling. For example, if your data is in the range [0, 2], a factor of
m = 0.1will result in a range [-0.2, 2.2].Negative values -0.5 < m < 0 will result in clipping of the data range. I.e. for a data range [0, 2], a factor of
m = -0.1will result in a range [0.2, 1.8].- Parameters
-
- mfloat greater than -0.5
- set_xscale(value, **kwargs)[source]
-
Set the x-axis scale.
- Parameters
-
- value{"linear"}
-
The axis scale type to apply. 3D axes currently only support linear scales; other scales yield nonsensical results.
- **kwargs
-
Keyword arguments are nominally forwarded to the scale class, but none of them is applicable for linear scales.
- set_ylim(bottom=None, top=None, emit=True, auto=False, *, ymin=None, ymax=None)[source]
-
Alias for
set_ylim3d.
- set_ylim3d(bottom=None, top=None, emit=True, auto=False, *, ymin=None, ymax=None)[source]
-
Set 3D y limits.
See
matplotlib.axes.Axes.set_ylim()for full documentation.
- set_ymargin(m)[source]
-
Set padding of Y data limits prior to autoscaling.
m times the data interval will be added to each end of that interval before it is used in autoscaling. For example, if your data is in the range [0, 2], a factor of
m = 0.1will result in a range [-0.2, 2.2].Negative values -0.5 < m < 0 will result in clipping of the data range. I.e. for a data range [0, 2], a factor of
m = -0.1will result in a range [0.2, 1.8].- Parameters
-
- mfloat greater than -0.5
- set_yscale(value, **kwargs)[source]
-
Set the y-axis scale.
- Parameters
-
- value{"linear"}
-
The axis scale type to apply. 3D axes currently only support linear scales; other scales yield nonsensical results.
- **kwargs
-
Keyword arguments are nominally forwarded to the scale class, but none of them is applicable for linear scales.
- set_zbound(lower=None, upper=None)[source]
-
Set the lower and upper numerical bounds of the z-axis.
This method will honor axes inversion regardless of parameter order. It will not change the autoscaling setting (
get_autoscalez_on()).
- set_zlabel(zlabel, fontdict=None, labelpad=None, **kwargs)[source]
-
Set zlabel. See doc for
set_ylabelfor description.
- set_zlim(bottom=None, top=None, emit=True, auto=False, *, zmin=None, zmax=None)[source]
-
Alias for
set_zlim3d.
- set_zlim3d(bottom=None, top=None, emit=True, auto=False, *, zmin=None, zmax=None)[source]
-
Set 3D z limits.
See
matplotlib.axes.Axes.set_ylim()for full documentation
- set_zmargin(m)[source]
-
Set padding of Z data limits prior to autoscaling.
m times the data interval will be added to each end of that interval before it is used in autoscaling.
accepts: float in range 0 to 1
- set_zscale(value, **kwargs)[source]
-
Set the z-axis scale.
- Parameters
-
- value{"linear"}
-
The axis scale type to apply. 3D axes currently only support linear scales; other scales yield nonsensical results.
- **kwargs
-
Keyword arguments are nominally forwarded to the scale class, but none of them is applicable for linear scales.
- set_zticklabels(labels, *, fontdict=None, minor=False, **kwargs)[source]
-
Set the zaxis' labels with list of string labels.
Warning
This method should only be used after fixing the tick positions using
Axes3D.set_zticks. Otherwise, the labels may end up in unexpected positions.- Parameters
-
- labelslist of str
-
The label texts.
- fontdictdict, optional
-
A dictionary controlling the appearance of the ticklabels. The default fontdict is:
{'fontsize': rcParams['axes.titlesize'], 'fontweight': rcParams['axes.titleweight'], 'verticalalignment': 'baseline', 'horizontalalignment': loc} - minorbool, default: False
-
Whether to set the minor ticklabels rather than the major ones.
- Returns
-
- list of
Text -
The labels.
- list of
- Other Parameters
-
-
**kwargs
Textproperties.
-
**kwargs
- set_zticks(ticks, labels=None, *, minor=False, **kwargs)[source]
-
Set the zaxis' tick locations and optionally labels.
If necessary, the view limits of the Axis are expanded so that all given ticks are visible.
- Parameters
-
- tickslist of floats
-
List of tick locations.
- labelslist of str, optional
-
List of tick labels. If not set, the labels show the data value.
- minorbool, default: False
-
If
False, set the major ticks; ifTrue, the minor ticks. - **kwargs
-
Textproperties for the labels. These take effect only if you pass labels. In other cases, please usetick_params.
Notes
The mandatory expansion of the view limits is an intentional design choice to prevent the surprise of a non-visible tick. If you need other limits, you should set the limits explicitly after setting the ticks.
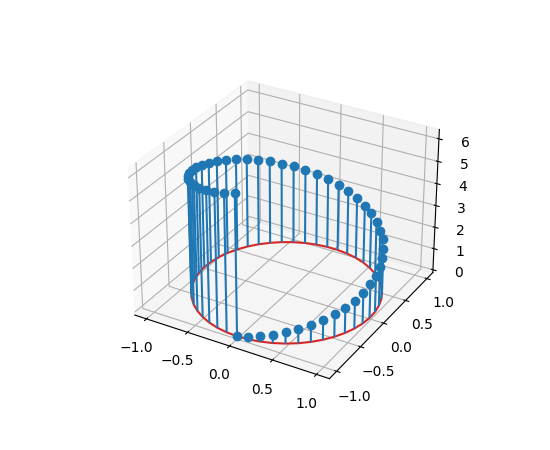
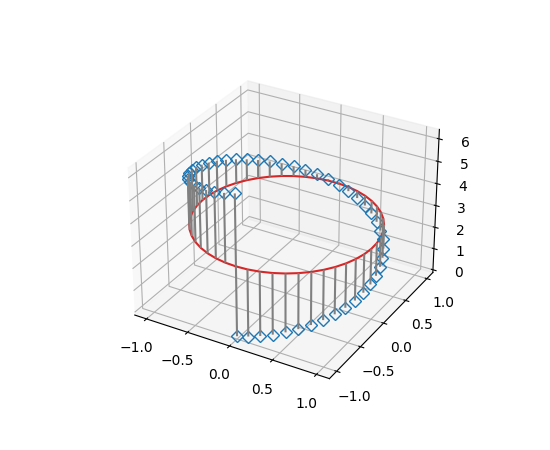
- stem(x, y, z, *, linefmt='C0-', markerfmt='C0o', basefmt='C3-', bottom=0, label=None, orientation='z', data=None)[source]
-
Create a 3D stem plot.
A stem plot draws lines perpendicular to a baseline, and places markers at the heads. By default, the baseline is defined by x and y, and stems are drawn vertically from bottom to z.
- Parameters
-
- x, y, zarray-like
-
The positions of the heads of the stems. The stems are drawn along the orientation-direction from the baseline at bottom (in the orientation-coordinate) to the heads. By default, the x and y positions are used for the baseline and z for the head position, but this can be changed by orientation.
- linefmtstr, default: 'C0-'
-
A string defining the properties of the vertical lines. Usually, this will be a color or a color and a linestyle:
Character
Line Style
'-'solid line
'--'dashed line
'-.'dash-dot line
':'dotted line
Note: While it is technically possible to specify valid formats other than color or color and linestyle (e.g. 'rx' or '-.'), this is beyond the intention of the method and will most likely not result in a reasonable plot.
- markerfmtstr, default: 'C0o'
-
A string defining the properties of the markers at the stem heads.
- basefmtstr, default: 'C3-'
-
A format string defining the properties of the baseline.
- bottomfloat, default: 0
-
The position of the baseline, in orientation-coordinates.
- labelstr, default: None
-
The label to use for the stems in legends.
- orientation{'x', 'y', 'z'}, default: 'z'
-
The direction along which stems are drawn.
- dataindexable object, optional
-
If given, all parameters also accept a string
s, which is interpreted asdata[s](unless this raises an exception).
- Returns
-
StemContainer-
The container may be treated like a tuple (markerline, stemlines, baseline)
Examples
(Source code, png, pdf)


- stem3D(x, y, z, *, linefmt='C0-', markerfmt='C0o', basefmt='C3-', bottom=0, label=None, orientation='z', data=None)[source]
-
Create a 3D stem plot.
A stem plot draws lines perpendicular to a baseline, and places markers at the heads. By default, the baseline is defined by x and y, and stems are drawn vertically from bottom to z.
- Parameters
-
- x, y, zarray-like
-
The positions of the heads of the stems. The stems are drawn along the orientation-direction from the baseline at bottom (in the orientation-coordinate) to the heads. By default, the x and y positions are used for the baseline and z for the head position, but this can be changed by orientation.
- linefmtstr, default: 'C0-'
-
A string defining the properties of the vertical lines. Usually, this will be a color or a color and a linestyle:
Character
Line Style
'-'solid line
'--'dashed line
'-.'dash-dot line
':'dotted line
Note: While it is technically possible to specify valid formats other than color or color and linestyle (e.g. 'rx' or '-.'), this is beyond the intention of the method and will most likely not result in a reasonable plot.
- markerfmtstr, default: 'C0o'
-
A string defining the properties of the markers at the stem heads.
- basefmtstr, default: 'C3-'
-
A format string defining the properties of the baseline.
- bottomfloat, default: 0
-
The position of the baseline, in orientation-coordinates.
- labelstr, default: None
-
The label to use for the stems in legends.
- orientation{'x', 'y', 'z'}, default: 'z'
-
The direction along which stems are drawn.
- dataindexable object, optional
-
If given, all parameters also accept a string
s, which is interpreted asdata[s](unless this raises an exception).
- Returns
-
StemContainer-
The container may be treated like a tuple (markerline, stemlines, baseline)
Examples
(Source code, png, pdf)
- text(x, y, z, s, zdir=None, **kwargs)[source]
-
Add text to the plot. kwargs will be passed on to Axes.text, except for the zdir keyword, which sets the direction to be used as the z direction.
- text2D(x, y, s, fontdict=None, **kwargs)[source]
-
Add text to the Axes.
Add the text s to the Axes at location x, y in data coordinates.
- Parameters
-
- x, yfloat
-
The position to place the text. By default, this is in data coordinates. The coordinate system can be changed using the transform parameter.
- sstr
-
The text.
- fontdictdict, default: None
-
A dictionary to override the default text properties. If fontdict is None, the defaults are determined by
rcParams.
- Returns
- Other Parameters
-
-
**kwargs
Textproperties. -
Other miscellaneous text parameters.
Property
Description
a filter function, which takes a (m, n, 3) float array and a dpi value, and returns a (m, n, 3) array
scalar or None
bool
color
dict with properties for
patches.FancyBboxPatchunknown
unknown
unknown
coloror ccolor
fontfamilyor family{FONTNAME, 'serif', 'sans-serif', 'cursive', 'fantasy', 'monospace'}
fontpropertiesor font or font_propertiesfontsizeor sizefloat or {'xx-small', 'x-small', 'small', 'medium', 'large', 'x-large', 'xx-large'}
fontstretchor stretch{a numeric value in range 0-1000, 'ultra-condensed', 'extra-condensed', 'condensed', 'semi-condensed', 'normal', 'semi-expanded', 'expanded', 'extra-expanded', 'ultra-expanded'}
fontstyleor style{'normal', 'italic', 'oblique'}
fontvariantor variant{'normal', 'small-caps'}
fontweightor weight{a numeric value in range 0-1000, 'ultralight', 'light', 'normal', 'regular', 'book', 'medium', 'roman', 'semibold', 'demibold', 'demi', 'bold', 'heavy', 'extra bold', 'black'}
str
horizontalalignmentor ha{'center', 'right', 'left'}
bool
object
float (multiple of font size)
str
multialignmentor ma{'left', 'right', 'center'}
bool
None or bool or float or callable
(float, float)
bool
float or {'vertical', 'horizontal'}
{None, 'default', 'anchor'}
(scale: float, length: float, randomness: float)
bool or None
object
bool
str
bool or None
verticalalignmentor va{'center', 'top', 'bottom', 'baseline', 'center_baseline'}
bool
bool
float
float
float
-
**kwargs
Examples
Individual keyword arguments can be used to override any given parameter:
>>> text(x, y, s, fontsize=12)
The default transform specifies that text is in data coords, alternatively, you can specify text in axis coords ((0, 0) is lower-left and (1, 1) is upper-right). The example below places text in the center of the Axes:
>>> text(0.5, 0.5, 'matplotlib', horizontalalignment='center',
...      verticalalignment='center', transform=ax.transAxes)
You can put a rectangular box around the text instance (e.g., to set a background color) by using the keyword bbox. bbox is a dictionary of
Rectangleproperties. For example:>>> text(x, y, s, bbox=dict(facecolor='red', alpha=0.5))
- text3D(x, y, z, s, zdir=None, **kwargs)[source]
-
Add text to the plot. kwargs will be passed on to Axes.text, except for the zdir keyword, which sets the direction to be used as the z direction.
- tick_params(axis='both', **kwargs)[source]
-
Convenience method for changing the appearance of ticks and tick labels.
See
matplotlib.axes.Axes.tick_params()for more complete documentation.The only difference is that setting axis to 'both' will mean that the settings are applied to all three axes. Also, the axis parameter also accepts a value of 'z', which would mean to apply to only the z-axis.
Also, because of how Axes3D objects are drawn very differently from regular 2D axes, some of these settings may have ambiguous meaning. For simplicity, the 'z' axis will accept settings as if it was like the 'y' axis.
Note
Axes3D currently ignores some of these settings.
- tricontour(*args, extend3d=False, stride=5, zdir='z', offset=None, data=None, **kwargs)[source]
-
Create a 3D contour plot.
Note
This method currently produces incorrect output due to a longstanding bug in 3D PolyCollection rendering.
- Parameters
-
- X, Y, Zarray-like
-
Input data. See
tricontourfor acceptable data shapes. - extend3dbool, default: False
-
Whether to extend contour in 3D.
- strideint
-
Step size for extending contour.
- zdir{'x', 'y', 'z'}, default: 'z'
-
The direction to use.
- offsetfloat, optional
-
If specified, plot a projection of the contour lines at this position in a plane normal to zdir.
- dataindexable object, optional
-
If given, all parameters also accept a string
s, which is interpreted asdata[s](unless this raises an exception). - *args, **kwargs
-
Other arguments are forwarded to
matplotlib.axes.Axes.tricontour.
- Returns
-
- matplotlib.tri.tricontour.TriContourSet
- tricontourf(*args, zdir='z', offset=None, data=None, **kwargs)[source]
-
Create a 3D filled contour plot.
Note
This method currently produces incorrect output due to a longstanding bug in 3D PolyCollection rendering.
- Parameters
-
- X, Y, Zarray-like
-
Input data. See
tricontourffor acceptable data shapes. - zdir{'x', 'y', 'z'}, default: 'z'
-
The direction to use.
- offsetfloat, optional
-
If specified, plot a projection of the contour lines at this position in a plane normal to zdir.
- dataindexable object, optional
-
If given, all parameters also accept a string
s, which is interpreted asdata[s](unless this raises an exception). - *args, **kwargs
-
Other arguments are forwarded to
matplotlib.axes.Axes.tricontourf.
- Returns
-
- matplotlib.tri.tricontour.TriContourSet
- tunit_cube(vals=None, M=None)[source]
- tunit_edges(vals=None, M=None)[source]
- unit_cube(vals=None)[source]
- update_datalim(xys, **kwargs)[source]
-
Extend the
dataLimBbox to include the given points.If no data is set currently, the Bbox will ignore its limits and set the bound to be the bounds of the xydata (xys). Otherwise, it will compute the bounds of the union of its current data and the data in xys.
- Parameters
-
- xys2D array-like
-
The points to include in the data limits Bbox. This can be either a list of (x, y) tuples or a Nx2 array.
- updatex, updateybool, default: True
-
Whether to update the x/y limits.
- view_init(elev=None, azim=None, vertical_axis='z')[source]
-
Set the elevation and azimuth of the axes in degrees (not radians).
This can be used to rotate the axes programmatically.
- Parameters
-
- elevfloat, default: None
-
The elevation angle in the vertical plane in degrees. If None then the initial value as specified in the
Axes3Dconstructor is used. - azimfloat, default: None
-
The azimuth angle in the horizontal plane in degrees. If None then the initial value as specified in the
Axes3Dconstructor is used. - vertical_axis{"z", "x", "y"}, default: "z"
-
The axis to align vertically. azim rotates about this axis.
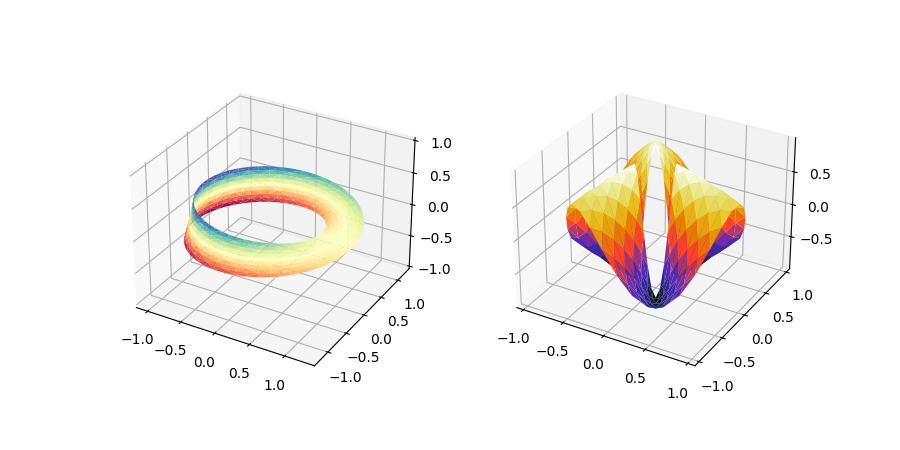
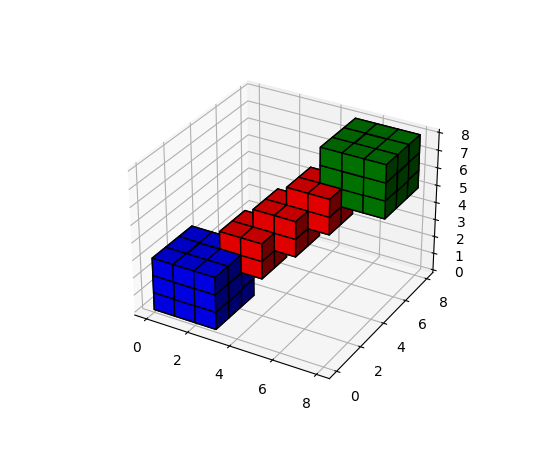
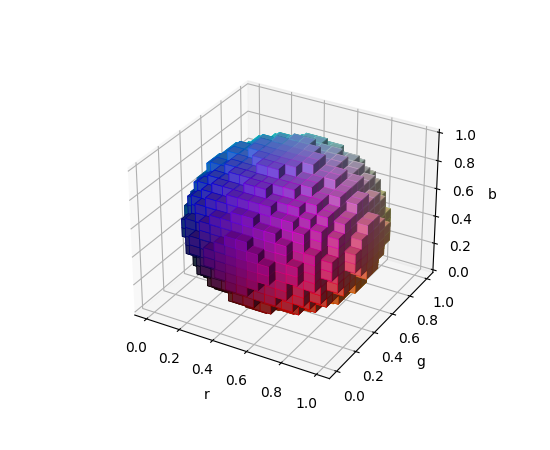
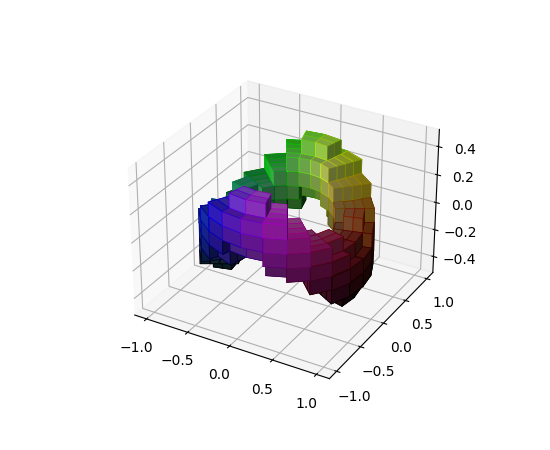
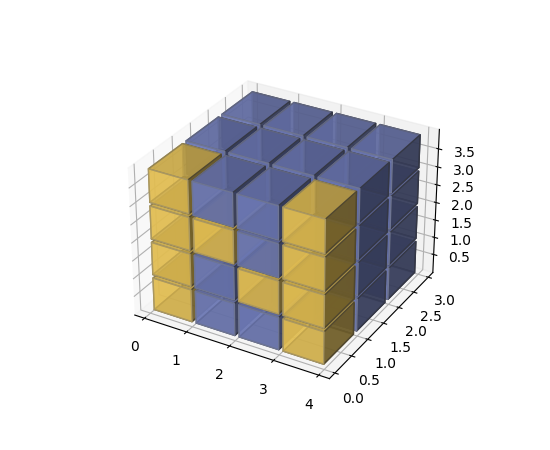
- voxels([x, y, z, ]/, filled, facecolors=None, edgecolors=None, **kwargs)[source]
-
Plot a set of filled voxels
All voxels are plotted as 1x1x1 cubes on the axis, with
filled[0, 0, 0]placed with its lower corner at the origin. Occluded faces are not plotted.- Parameters
-
- filled3D np.array of bool
-
A 3D array of values, with truthy values indicating which voxels to fill
- x, y, z3D np.array, optional
-
The coordinates of the corners of the voxels. This should broadcast to a shape one larger in every dimension than the shape of filled. These can be used to plot non-cubic voxels.
If not specified, defaults to increasing integers along each axis, like those returned by
indices(). As indicated by the/in the function signature, these arguments can only be passed positionally. - facecolors, edgecolorsarray-like, optional
-
The color to draw the faces and edges of the voxels. Can only be passed as keyword arguments. These parameters can be:
- A single color value, to color all voxels the same color. This can be either a string, or a 1D rgb/rgba array
-
None, the default, to use a single color for the faces, and the style default for the edges. - A 3D ndarray of color names, with each item the color for the corresponding voxel. The size must match the voxels.
- A 4D ndarray of rgb/rgba data, with the components along the last axis.
- shadebool, default: True
-
Whether to shade the facecolors. Shading is always disabled when cmap is specified.
-
lightsource
LightSource -
The lightsource to use when shade is True.
- **kwargs
-
Additional keyword arguments to pass onto
Poly3DCollection.
- Returns
-
- facesdict
-
A dictionary indexed by coordinate, where
faces[i, j, k]is aPoly3DCollectionof the faces drawn for the voxelfilled[i, j, k]. If no faces were drawn for a given voxel, either because it was not asked to be drawn, or it is fully occluded, then(i, j, k) not in faces.
Examples
(Source code, png, pdf)

(Source code, png, pdf)

(Source code, png, pdf)

(Source code, png, pdf)

- propertyw_xaxis[source]
- propertyw_yaxis[source]
- propertyw_zaxis[source]
- zaxis_date(tz=None)[source]
-
Set up axis ticks and labels to treat data along the zaxis as dates.
- Parameters
-
-
tzstr or
datetime.tzinfo, default:rcParams["timezone"](default:'UTC') -
The timezone used to create date labels.
-
tzstr or
Notes
This function is merely provided for completeness, but 3D axes do not support dates for ticks, and so this may not work as expected.
- zaxis_inverted()[source]
-
Returns True if the z-axis is inverted.
© 2012–2021 Matplotlib Development Team. All rights reserved.
Licensed under the Matplotlib License Agreement.
https://matplotlib.org/3.5.1/api/_as_gen/mpl_toolkits.mplot3d.axes3d.Axes3D.html