W3cubDocs
/React NativeDebugging
Accessing the In-App Developer Menu
You can access the developer menu by shaking your device or by selecting "Shake Gesture" inside the Hardware menu in the iOS Simulator. You can also use the ⌘D keyboard shortcut when your app is running in the iOS Simulator, or ⌘M when running in an Android emulator on Mac OS and Ctrl+M on Windows and Linux. Alternatively for Android, you can run the command adb shell input keyevent 82 to open the dev menu (82 being the Menu key code).

The Developer Menu is disabled in release (production) builds.
Enabling Fast Refresh
Fast Refresh is a React Native feature that allows you to get near-instant feedback for changes in your React components. While debugging, it can help to have Fast Refresh enabled. Fast Refresh is enabled by default, and you can toggle "Enable Fast Refresh" in the React Native developer menu. When enabled, most of your edits should be visible within a second or two.
Enabling Keyboard Shortcuts
React Native supports a few keyboard shortcuts in the iOS Simulator. They are described below. To enable them, open the Hardware menu, select Keyboard, and make sure that "Connect Hardware Keyboard" is checked.
LogBox
Errors and warnings in development builds are displayed in LogBox inside your app.
LogBox is automatically disabled in release (production) builds.
Console Errors and Warnings
Console errors and warnings are displayed as on-screen notifications with a red or yellow badge, and the number of errors or warning in the console respectively. To view a console error or warnings, tap the notification to view the full screen information about the log and to paginate through all of the logs in the console.
These notifications can be hidden using LogBox.ignoreAllLogs(). This is useful when giving product demos, for example. Additionally, notifications can be hidden on a per-log basis via LogBox.ignoreLogs(). This is useful when there's a noisy warning that cannot be fixed, like those in a third-party dependency.
Ignore logs as a last resort and create a task to fix any logs that are ignored.
import { LogBox } from 'react-native';

// Ignore log notification by message:
LogBox.ignoreLogs(['Warning: ...']);

// Ignore all log notifications:
LogBox.ignoreAllLogs();
Unhandled Errors
Unhandled JavaScript errors such as undefined is not a function will automatically open a full screen LogBox error with the source of the error. These errors are dismissable and minimizable so that you can see the state of your app when these errors occur, but should always be addressed.
Syntax Errors
When syntax error occurs the full screen LogBox error will automatically open with the stack trace and location of the syntax error. This error is not dismissable because it represents invalid JavaScript execution that must be fixed before continuing with your app. To dismiss these errors, fix the syntax error and either save to automatically dismiss (with Fast Refresh enabled) or cmd+r to reload (with Fast Refresh disabled).
Chrome Developer Tools
To debug the JavaScript code in Chrome, select "Debug JS Remotely" from the Developer Menu. This will open a new tab at http://localhost:8081/debugger-ui.
Select Tools → Developer Tools from the Chrome Menu to open the Developer Tools. You may also access the DevTools using keyboard shortcuts (⌘⌥I on macOS, Ctrl Shift I on Windows). You may also want to enable Pause On Caught Exceptions for a better debugging experience.
Note: on Android, if the times between the debugger and device have drifted; things such as animation, event behavior, etc., might not work properly or the results may not be accurate. Please correct this by running
adb shell "date `date +%m%d%H%M%Y.%S%3N`"on your debugger machine. Root access is required for the use in real device.
Note: the React Developer Tools Chrome extension does not work with React Native, but you can use its standalone version instead. Read this section to learn how.
Debugging using a custom JavaScript debugger
To use a custom JavaScript debugger in place of Chrome Developer Tools, set the REACT_DEBUGGER environment variable to a command that will start your custom debugger. You can then select "Debug JS Remotely" from the Developer Menu to start debugging.
The debugger will receive a list of all project roots, separated by a space. For example, if you set REACT_DEBUGGER="node /path/to/launchDebugger.js --port 2345 --type ReactNative", then the command node /path/to/launchDebugger.js --port 2345 --type ReactNative /path/to/reactNative/app will be used to start your debugger.
Custom debugger commands executed this way should be short-lived processes, and they shouldn't produce more than 200 kilobytes of output.
Safari Developer Tools
You can use Safari to debug the iOS version of your app without having to enable "Debug JS Remotely".
- Enable Develop menu in Safari:
Preferences → Advanced → Select "Show Develop menu in menu bar" - Select your app's JSContext:
Develop → Simulator → JSContext - Safari's Web Inspector should open which has a Console and a Debugger
While sourcemaps may not be enabled by default, you can follow this guide or video to enable them and set break points at the right places in the source code.
However, every time the app is reloaded (using live reload, or by manually reloading), a new JSContext is created. Choosing "Automatically Show Web Inspectors for JSContexts" saves you from having to select the latest JSContext manually.
React Developer Tools
You can use the standalone version of React Developer Tools to debug the React component hierarchy. To use it, install the react-devtools package globally:
Note: Version 4 of
react-devtoolsrequiresreact-nativeversion 0.62 or higher to work properly.
- npm
- Yarn
npm install -g react-devtools
yarn global add react-devtools
Now run react-devtools from the terminal to launch the standalone DevTools app:
react-devtools
It should connect to your simulator within a few seconds.
Note: if you prefer to avoid global installations, you can add
react-devtoolsas a project dependency. Add thereact-devtoolspackage to your project usingnpm install --save-dev react-devtools, then add"react-devtools": "react-devtools"to thescriptssection in yourpackage.json, and then runnpm run react-devtoolsfrom your project folder to open the DevTools.
Integration with React Native Inspector
Open the in-app developer menu and choose "Toggle Inspector". It will bring up an overlay that lets you tap on any UI element and see information about it:
However, when react-devtools is running, Inspector will enter a collapsed mode, and instead use the DevTools as primary UI. In this mode, clicking on something in the simulator will bring up the relevant components in the DevTools:
You can choose "Toggle Inspector" in the same menu to exit this mode.
Inspecting Component Instances
When debugging JavaScript in Chrome, you can inspect the props and state of the React components in the browser console.
First, follow the instructions for debugging in Chrome to open the Chrome console.
Make sure that the dropdown in the top left corner of the Chrome console says debuggerWorker.js. This step is essential.
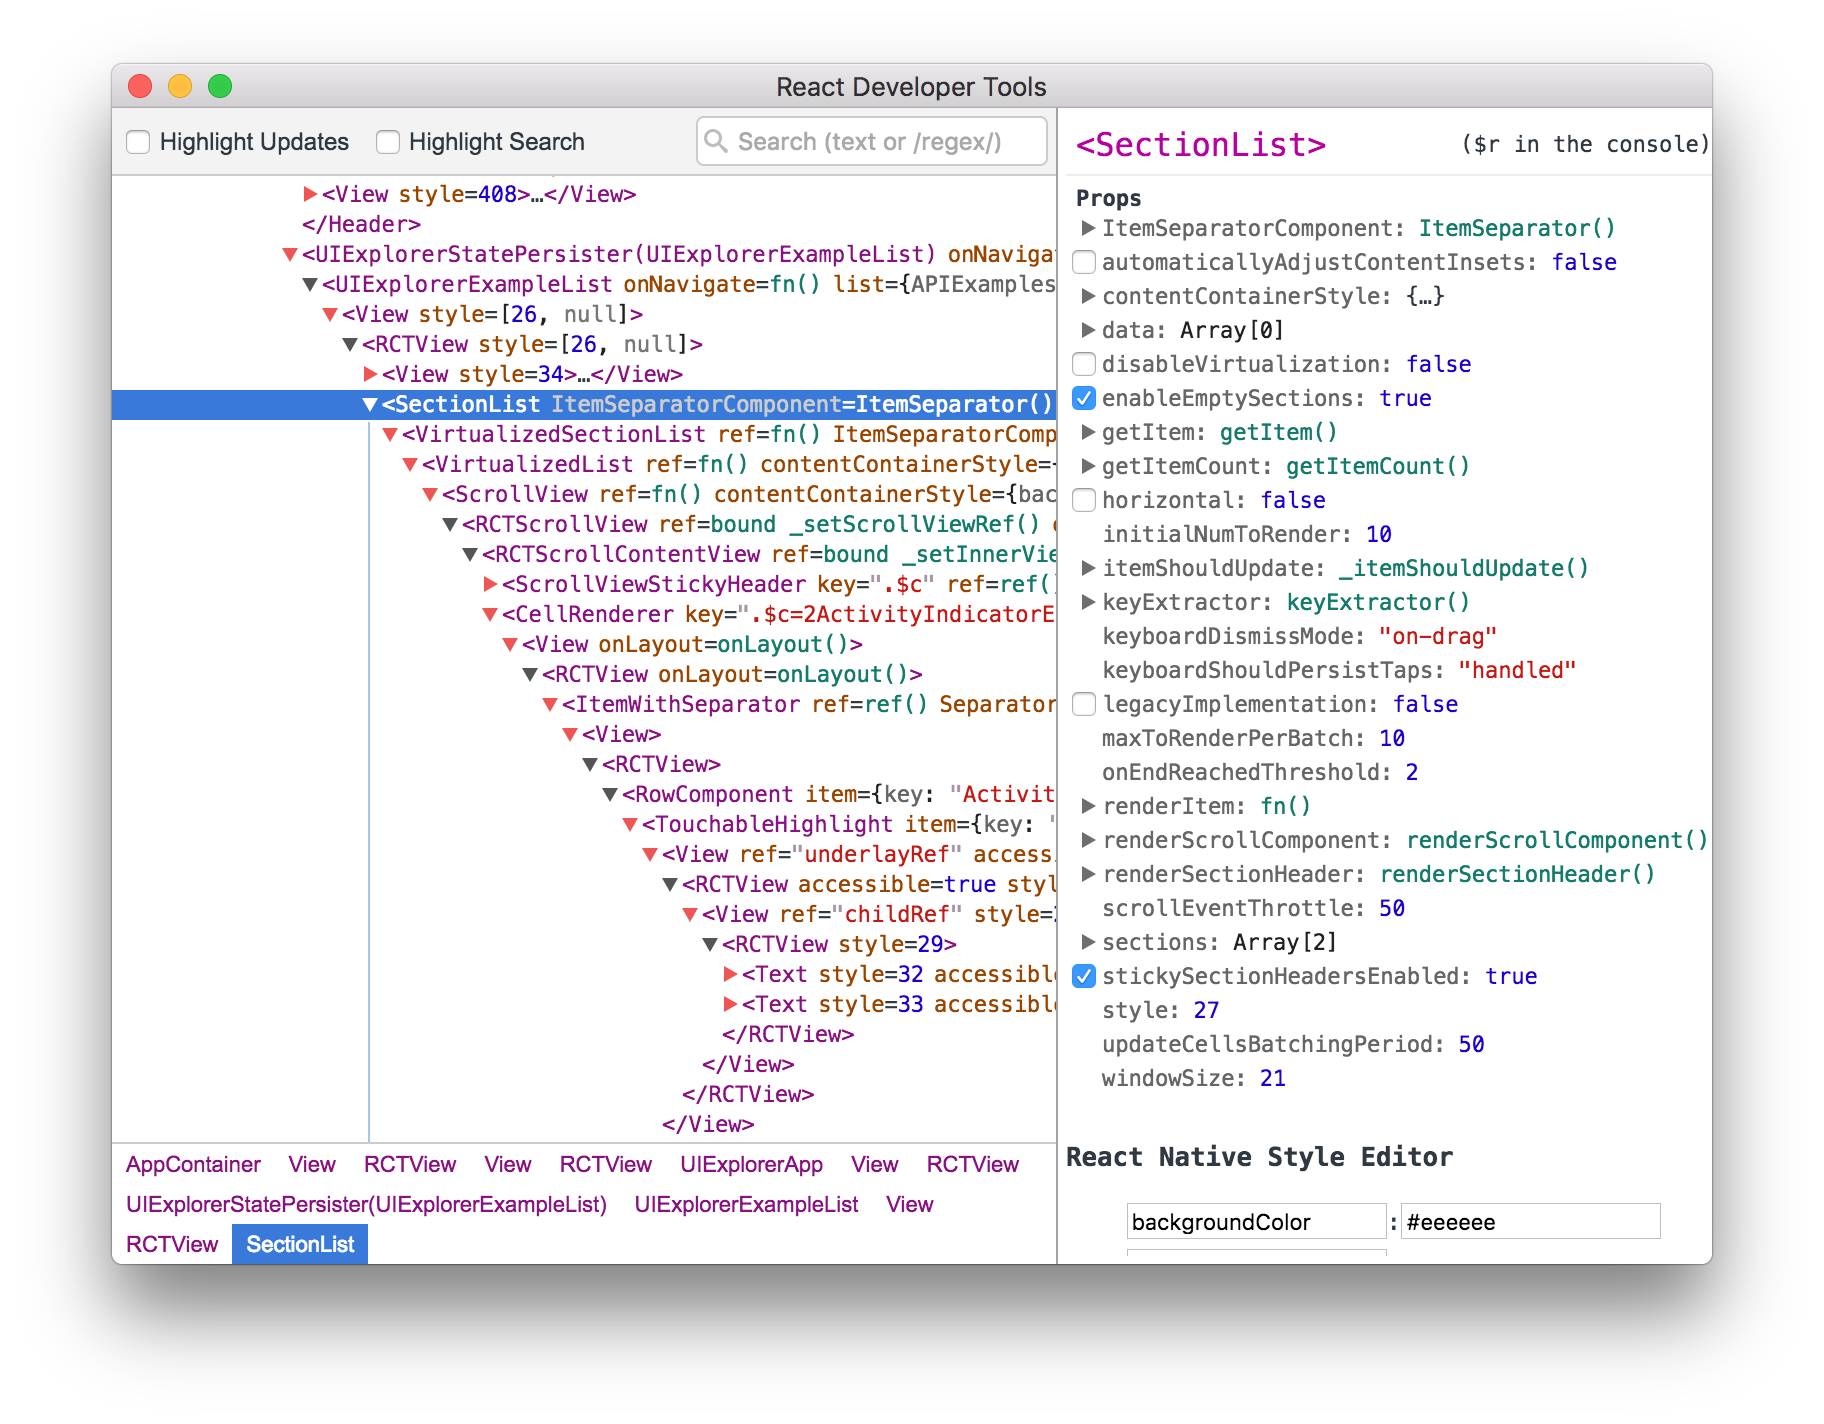
Then select a React component in React DevTools. There is a search box at the top that helps you find one by name. As soon as you select it, it will be available as $r in the Chrome console, letting you inspect its props, state, and instance properties.
Performance Monitor
You can enable a performance overlay to help you debug performance problems by selecting "Perf Monitor" in the Developer Menu.
Debugging Application State
Reactotron is an open-source desktop app that allows you to inspect Redux or MobX-State-Tree application state as well as view custom logs, run custom commands such as resetting state, store and restore state snapshots, and other helpful debugging features for React Native apps.
You can view installation instructions in the README. If you're using Expo, here is an article detailing how to install on Expo.
Native Debugging
Projects with Native Code Only
The following section only applies to projects with native code exposed. If you are using the managed Expo workflow, see the guide on prebuild to use this API.
Accessing console logs
You can display the console logs for an iOS or Android app by using the following commands in a terminal while the app is running:
npx react-native log-ios
npx react-native log-android
You may also access these through Debug → Open System Log... in the iOS Simulator or by running adb logcat *:S ReactNative:V ReactNativeJS:V in a terminal while an Android app is running on a device or emulator.
If you're using Create React Native App or Expo CLI, console logs already appear in the same terminal output as the bundler.
Debugging on a device with Chrome Developer Tools
If you're using Create React Native App or Expo CLI, this is configured for you already.
On iOS devices, open the file RCTWebSocketExecutor.mm and change "localhost" to the IP address of your computer, then select "Debug JS Remotely" from the Developer Menu.
On Android 5.0+ devices connected via USB, you can use the adb command line tool to setup port forwarding from the device to your computer:
adb reverse tcp:8081 tcp:8081
Alternatively, select "Dev Settings" from the Developer Menu, then update the "Debug server host for device" setting to match the IP address of your computer.
If you run into any issues, it may be possible that one of your Chrome extensions is interacting in unexpected ways with the debugger. Try disabling all of your extensions and re-enabling them one-by-one until you find the problematic extension.
Debugging native code
When working with native code, such as when writing native modules, you can launch the app from Android Studio or Xcode and take advantage of the native debugging features (setting up breakpoints, etc.) as you would in case of building a standard native app.
© 2022 Facebook Inc.
Licensed under the Creative Commons Attribution 4.0 International Public License.
https://reactnative.dev/docs/debugging